
Video transcriptWhat Does Mold Mean for Me and My Health?
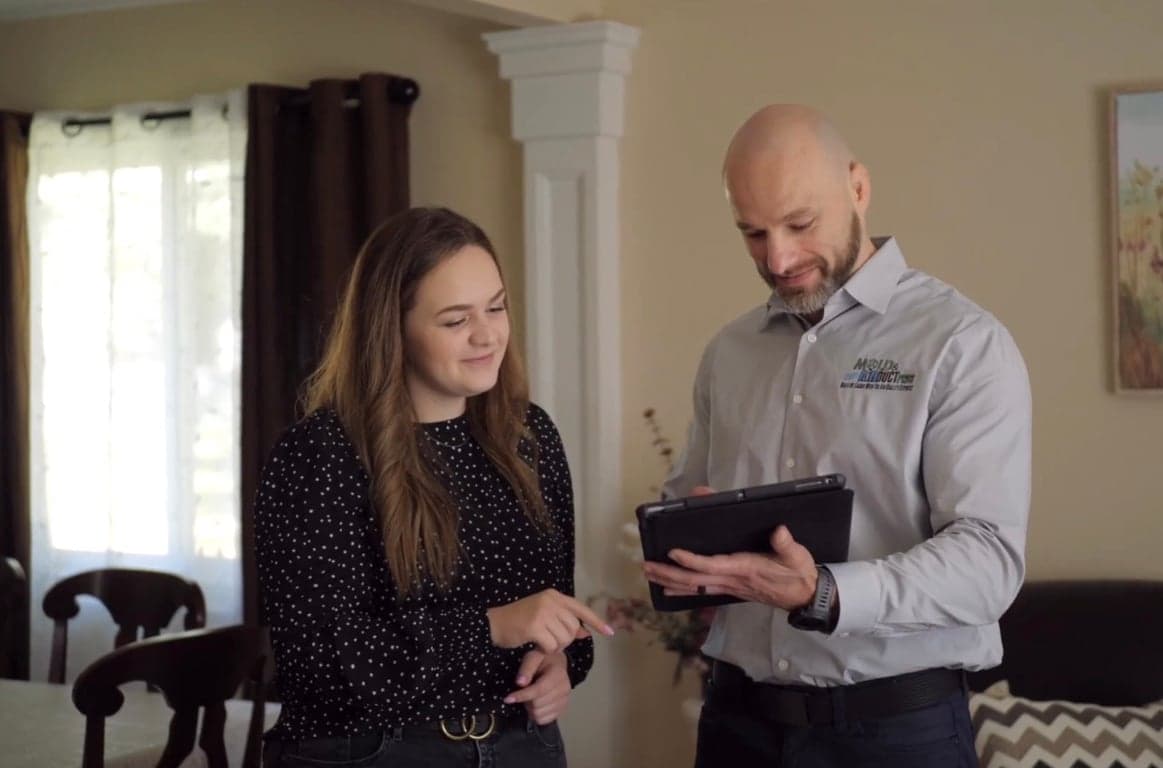
What does mold mean for me and my health? Hi, I'm Josh from Mold and Air Duct Pros, based in Cleveland, Ohio. There are over 100,000 species of mold, and each person's body may react differently to each mold type. The elderly, infants, young children, individuals with immune suppression, or those with underlying lung disease may be more sensitive to mold exposure and may experience more severe symptoms.
The most common mold-related symptoms are nasal stuffiness, throat irritation, coughing or wheezing, eye or skin irritation, headaches, lack of mental clarity, or in more severe cases, fever and difficulty breathing. Allergic reactions may happen immediately or develop after a period following exposure. Both growing mold and even dead mold spores may lead to allergic reactions. That's why we HEPA vacuum each square inch of the contaminated area after the treatment, to remove the dead mold spores.
Mold has been known to cause asthma attacks in people who have asthma and are allergic to mold. Regardless of your health condition, it's best to stay on top of any mold issues in your home or office and take proper steps to protect yourself. If you have any concerns about potential mold in your home or office, give Mold and Air Duct Pros a call at (440) 467-4104.
Interactive 2025 Greater Cleveland Particle Pollution Map
The colored layer visualizes relative concentrations across the region, while the dots preserve the underlying EPA monitor locations. Select PM2.5 or PM10, move through the 2025 monthly timeline, or press play to see how the pattern changed. Clicking a dot shows measured monitor evidence. Clicking elsewhere shows a clearly labeled interpolated estimate and the distance to the nearest monitor.
See particle concentrations change across Greater Cleveland
Scrub through 2025 or press play. Colored areas are interpolated from regional EPA monitors; dots are the only measured locations.
Building the concentration surface and monitor layers...
Color shows relative concentration in µg/m³, not AQI. Fainter color marks areas farther from monitors or beyond the support-monitor hull. Tap the surface for an estimate; tap a dot for a measurement.
Showing PM2.5, 2025 annual average. Metro monitor values range from 6.8 to 10.7 µg/m³. Interpolated surface visible. Monitor dots visible.
District 6
AQS 39-035-0034 | Cuyahoga County
365 valid site-days informed the annual series. The displayed annual value uses the official EPA source where available.
January through December
881 E. 152nd ST., Cleveland, Ohio. Monthly values are descriptive arithmetic means, not regulatory design values.
| Measure | Jan | Feb | Mar | Apr | May | Jun | Jul | Aug | Sep | Oct | Nov | Dec |
|---|---|---|---|---|---|---|---|---|---|---|---|---|
| Mean (µg/m³) | 6.7 | 7.8 | 5.4 | 5.3 | 5.1 | 12.3 | 10.7 | 10.1 | 7.0 | 4.3 | 6.0 | 7.8 |
| Valid days | 31 | 28 | 31 | 30 | 31 | 30 | 31 | 31 | 30 | 31 | 30 | 31 |
Metro monitor values for 2025 average
| Monitor | County | Mean (µg/m³) | Data coverage |
|---|---|---|---|
| 39-035-0034 | Cuyahoga | 7.3 | 365 valid days |
| 39-035-0038 | Cuyahoga | 9.4 | 363 valid days |
| 39-035-0045 | Cuyahoga | 8.9 | 360 valid days |
| 39-035-0060 | Cuyahoga | 9.3 | 362 valid days |
| 39-035-0065 | Cuyahoga | 10.7 | 363 valid days |
| 39-035-0073 | Cuyahoga | 7.4 | 363 valid days |
| 39-085-0007 | Lake | 6.8 | 363 valid days |
| 39-103-0004 | Medina | 7.4 | 361 valid days |
How the surface was calculated, tested, and limited
Measured versus interpolated. Monitor dots show measured values. Every other colored location is an inverse-distance estimate from up to 10 nearby qualifying monitors. The calculation requires at least four monitors within 150 km and uses distance to the fifth power.
Why colors fade. Opacity is reduced beyond 40 km from the nearest monitor and outside the support-monitor convex hull. This is a visual distance cue, not a statistical confidence interval. The surface remains clipped to the six counties.
Time. Annual values use EPA final or certified annual sources. Monthly arithmetic means were calculated from EPA daily summaries and require at least 75% of calendar days in every included site-month. EPA does not publish these monthly means as regulatory design values.
Cross-validation. PM2.5 annual leave-one-site-out error was 1.0 µg/m³ mean absolute error. Pooled monthly error was 1.0 µg/m³. These errors quantify model performance at monitor locations, not at every address.
EPA AirNow interpolation-method explanation | EPA PM2.5 daily file | EPA PM10 daily file
The map describes fixed outdoor monitors in 2025. It does not represent current air quality, indoor conditions, personal exposure, or regulatory attainment at a clicked location.
Data retrieved Aug 4, 2026 | Surface schema v2
Updated August 4, 2026: Just weeks before this update, Greater Cleveland experienced a major smoke episode. On July 16, dense smoke from hundreds of wildfires in northwestern Ontario settled over northern Ohio. The National Weather Service reported visibility of roughly one-half to one mile in parts of Northeast Ohio, while the Cleveland Division of Air Quality issued a health alert for elevated fine-particle pollution.
Preliminary AirNow daily files placed every fixed PM2.5 monitor reporting in Cuyahoga County in the EPA's “Very Unhealthy” AQI category on both July 16 and July 17. Reported daily AQIs ranged from 257 to 297 on July 16 and 230 to 257 on July 17. AirNow data are preliminary and can be revised after quality assurance. The City kept City Hall and Public Auditorium closed to the public on July 17 and extended hours at several recreation centers so residents had places to seek relief.
The EPA described the July 2026 smoke as a cross-border event affecting a large portion of the United States. Cleveland's experience is a timely reminder that particle concentrations can change rapidly and that a yearly average cannot replace current alerts.
The July 2026 event is not included in this map. The visualization uses 2025 because it is the latest complete calendar year supported by finalized EPA particulate data. For conditions today, check AirNow's current AQI and Fire and Smoke Map.
Outdoor air quality can affect health, especially for children, older adults, people with heart or lung conditions, and people who spend substantial time outdoors. This article focuses on ambient particulate matter measured by regulatory monitors. The map does not measure indoor air, identify mold, or estimate any one person's exposure.
The video above discusses mold and health. It provides indoor environmental context, while the map separately examines outdoor particulate pollution.
Wildfire smoke is only one possible contributor. Traffic, power generation, industry, construction dust, natural sources, and other combustion or mechanical processes can also contribute particles or particle-forming pollutants to outdoor air.

What PM2.5 and PM10 Mean
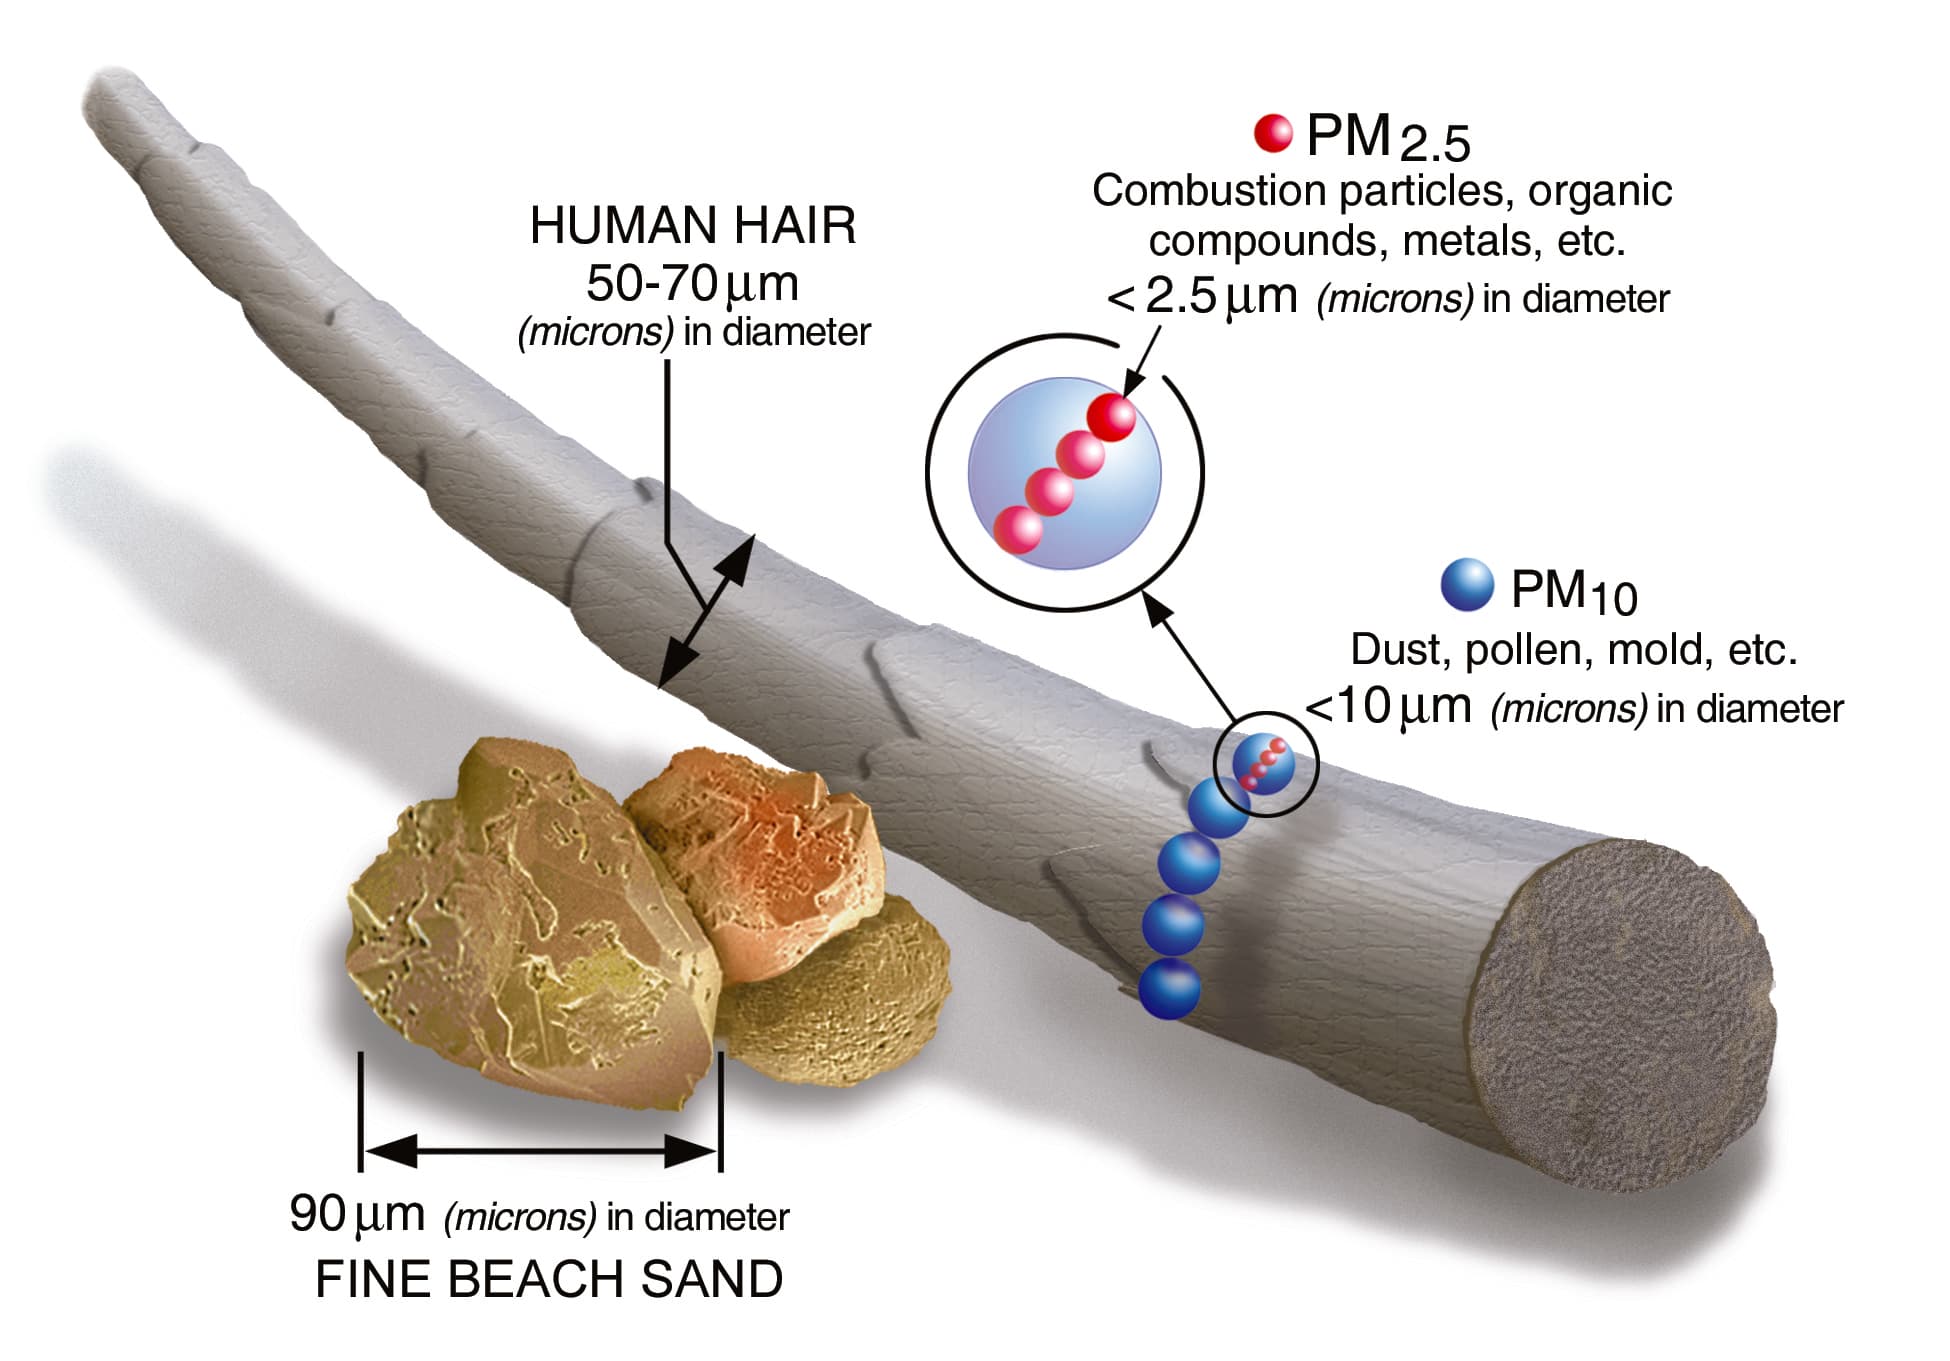
Particulate matter is a mixture of solid particles and liquid droplets suspended in air. The categories overlap:
- PM10 includes inhalable particles with aerodynamic diameters generally 10 micrometers or smaller.
- PM2.5 includes fine particles generally 2.5 micrometers or smaller. PM2.5 is therefore part of PM10, not a separate quantity that should be added to it.
Outdoor PM monitors measure particle mass, not particle identity. A PM10 or PM2.5 reading cannot tell us how much of the measured material was smoke, dust, pollen, mold spores, or another component.
Research reviewed by the U.S. Environmental Protection Agency and the World Health Organization associates short-term and long-term particle exposure with respiratory and cardiovascular effects. Risk varies with concentration, duration, particle composition, individual health, and other factors. An outdoor monitor cannot diagnose a health condition or calculate a person's total exposure.
WHO Guidelines and EPA Standards Are Different
The 2021 WHO Global Air Quality Guidelines are health-based recommendations intended to help governments and public-health authorities reduce population exposure. They are not legal limits, and they should not be described as a boundary between safe and unsafe air.
WHO recommends these ambient-air guideline levels:
- PM2.5: 5 micrograms per cubic meter (µg/m³) as an annual mean and 15 µg/m³ as the 99th percentile of 24-hour means, equivalent to three or four exceedance days per year.
- PM10: 15 µg/m³ as an annual mean and 45 µg/m³ as the 99th percentile of 24-hour means, equivalent to three or four exceedance days per year.
The EPA National Ambient Air Quality Standards are U.S. regulatory standards with specific statistical forms:
- Annual PM2.5: 9.0 µg/m³, evaluated as the three-year average of annual means.
- 24-hour PM2.5: 35 µg/m³, evaluated as the three-year average of each year's annual 98th-percentile 24-hour concentration.
- 24-hour PM10: 150 µg/m³, not to be exceeded more than once per year on average over three years.
A single 2025 annual mean, percentile, maximum, or daily result is useful descriptive information, but it does not by itself establish whether an area meets or violates a federal standard. EPA's official design values combine three years of data and apply pollutant-specific completeness, monitor-combination, rounding, and exceptional-event rules.
Why This Map Uses 2025 Data
For this update, 2025 is the latest complete calendar year with published EPA particulate data and 2025 design-value reports. Data collected during 2026 are still year-to-date and may be submitted, validated, or revised after this article's August 4, 2026 research cutoff. Mixing partial 2026 data with a complete 2025 year would create a misleading comparison.
EPA's 2025 design values cover the 2023-2025 period. They are different from the single-year 2025 measurements shown for individual monitors. EPA also notes that published design values may later change when data, exceptional-event determinations, or monitor information are revised.
What “Greater Cleveland” Means Here
We use the current Cleveland, Ohio Metropolitan Statistical Area defined in OMB Bulletin 23-01, published in July 2023. It consists of six Ohio counties:
- Ashtabula
- Cuyahoga
- Geauga
- Lake
- Lorain
- Medina
EPA's AQS records still use an older Cleveland-Elyria metropolitan code, so the research selected records by county rather than relying on that legacy metro code. Qualifying 2025 PM records were available only at monitor locations in Cuyahoga, Lake, and Medina counties. A county with no marker has no qualifying monitor in this dataset. It should not be interpreted as having zero pollution or better air.
How the Data Were Prepared
The source files were downloaded from EPA on August 4, 2026. PM2.5 values come from EPA's final 2023-2025 PM2.5 design-value workbook, which reports site-level 2025 annual means and 98th-percentile daily concentrations for AQS parameter 88101. Using EPA's site-level result preserves the agency's rules for combining a primary monitor with eligible collocated monitors.
PM10 values come from EPA's certified 2025 annual concentration summaries by monitor for AQS parameter 81102. The research selected the active NAAQS-primary monitor at each site, complete 24-hour block-average summaries, the PM10 24-hour 2006 standard row, and the AQS No Events summary category. EPA's final 2023-2025 PM10 design-value workbook was used to check monitor status and regulatory context.
The monthly timeline is calculated from EPA's final 2025 PM2.5 daily summaries and 2025 PM10 daily summaries. EPA does not publish monthly summaries in these files. For PM2.5, each site-day uses the active primary monitor when available and valid collocated parameter 88101 values when the primary value is missing. PM10 uses the active primary monitor. Every site in the timeline has valid site-day values for at least 75% of calendar days in every month. This is a conservative visualization rule, not an EPA monthly compliance test.
EPA labels the PM2.5 source values as micrograms per cubic meter at local conditions and the PM10 source values as micrograms per cubic meter at 25 °C. The map preserves that source-unit distinction in each site's details while using µg/m³ as the compact display unit.
No Events is an AQS data-category label. It does not prove that smoke, dust, fireworks, or another episodic source had no influence during the year.
The colored surface is an interpolation, not a direct measurement between monitors. It uses the EPA AirNow contour approach: inverse-distance weighting with power 5, the 10 nearest eligible monitors, and an approximately 5 km grid. The supporting network includes every qualifying monitor within 100 km of downtown Cleveland, then clips the displayed surface to the six counties. This reduces edge distortion without pretending the outside monitors measured conditions inside the metro.
Colors become fainter farther from a monitor and outside the monitor-network boundary. That opacity is a monitor-distance cue, not a statistical confidence interval. Leave-one-monitor-out testing produced a pooled monthly RMSE of 1.25 µg/m³ for PM2.5 and 5.28 µg/m³ for PM10 at monitored locations. Error can be larger in unmonitored areas, especially for PM10. The map does not assign a result to an entire neighborhood or county, calculate population exposure, or determine indoor air quality.
Annual values smooth over substantial day-to-day variation. For current conditions and activity decisions, use AirNow and follow local public-health guidance.

Practical Next Steps
For Outdoor Air
Check AirNow before prolonged outdoor activity, especially if you or someone in your household is in a group that may be more affected by particle pollution. On elevated-PM days, follow the current recommendations from public-health officials. This annual map provides historical context, not today's conditions.
For Indoor Air
Outdoor particles can enter buildings, but indoor concentrations also depend on ventilation, filtration, building leakage, occupant activities, and indoor sources. A nearby outdoor monitor cannot determine the air quality inside your home.
EPA's guidance on air cleaners and HVAC filters in the home can help homeowners understand available options and important limitations. A qualified HVAC professional can also help determine which filter or air-cleaning approach is compatible with a particular system. No single device removes every indoor contaminant.
Mold is a separate indoor environmental question. If you see suspected growth, notice moisture damage, or want conditions documented throughout the property, professional mold inspection and testing can help. If you are in Northeast Ohio and would like to discuss what you are seeing, call us or send us a message.
Primary Sources
- Cleveland Division of Air Quality July 2026 health alert
- City of Cleveland July 2026 closure and extended recreation-center hours
- NOAA/NWS Cleveland July 2026 forecast-discussion archive
- EPA July 2026 cross-border wildfire-smoke statement
- AirNow preliminary daily data for July 16, 2026
- AirNow preliminary daily data for July 17, 2026
- AirNow daily-data methodology and quality-assurance caveat
- EPA AirData download files
- EPA 2025 PM2.5 daily summaries
- EPA 2025 PM10 daily summaries
- EPA AirNow contour interpolation method
- EPA final 2023-2025 PM2.5 design-value workbook
- EPA final 2023-2025 PM10 design-value workbook
- EPA 2025 air quality design values
- EPA National Ambient Air Quality Standards
- WHO Global Air Quality Guidelines
- OMB Bulletin 23-01 metropolitan-area definitions
- U.S. Census Bureau metropolitan-area delineation files